Data accuracyMore consistent building data, with fewer errors reaching the energy model.
← All work
Climate Tech · Field Operations · Customer Journey
Enter
A climate-tech startup helping German homeowners plan energy-efficient renovations. I designed the advisor tool used in the field and the customer journey, from the first on-site visit to the official retrofit report.

iSFP
Official govt. document
generated from field data
generated from field data
2D
Live floor plans with
window-level precision
window-level precision
Built
Field tool & customer journey
designed from scratch
designed from scratch
The context
Billions in renovation funding.
The data to unlock it
didn’t yet exist.
Enter helps German homeowners navigate energy-efficient renovations, from insulation and heat pumps to new windows and the government funding that can cover much of the cost. Through the Bundesförderung für effiziente Gebäude (BEG), homeowners can receive subsidies of up to 70% for certain measures. To qualify, they need an Individual Renovation Roadmap (iSFP) prepared by a certified energy advisor following an on-site assessment.
That visit is the foundation of everything that follows: the energy model, the retrofit recommendations it generates, and the official report homeowners need to claim funding.
When I joined, advisors relied on paper forms, handwritten notes, and fragmented workflows. Data was inconsistent, difficult to digitise, and unsuitable for a scalable AI pipeline. There was no dedicated product for advisors collecting information in the field, or for homeowners trying to understand their renovation options and next steps.
I led the design of both experiences: a tablet-first field app that guides energy advisors through on-site assessments, and a digital customer report that helps homeowners understand recommendations, compare renovation scenarios, and move confidently toward funding and implementation.
End to end
Field data. AI model.
Government document.
One continuous flow.
Field Visit
Advisor conducts the assessment on site using a tablet
→
Building Survey
Rooms, floors, construction materials, windows, heating systems and a detailed floor plan are captured
→
AI Processing
The assessment data is analysed to generate the building’s energy model and recommended retrofit measures
→
Customer Report
The advisor reviews the results with the homeowner: assessment, recommended measures, expected savings and available subsidies
→
Final iSFP
The agreed measures are compiled into the official Individual Renovation Roadmap, ready to support government funding applications
Appointment management
Everything the advisor needs
before they
knock on the door.
The appointment screen was the starting point for every property visit. Before tapping “Start appointment”, advisors could review the homeowner’s details, view the property on a map, check the estimated building size, and quickly call the client or open navigation. The iSFP assessment remained intentionally locked. Starting the appointment marked the beginning of the official assessment and unlocked the data collection flow.
Once the assessment data had been uploaded, the same screen reflected the appointment’s completion and unlocked the customer report. It could only be generated after every required section of the survey had been completed and submitted, so every recommendation rested on a complete, validated dataset.
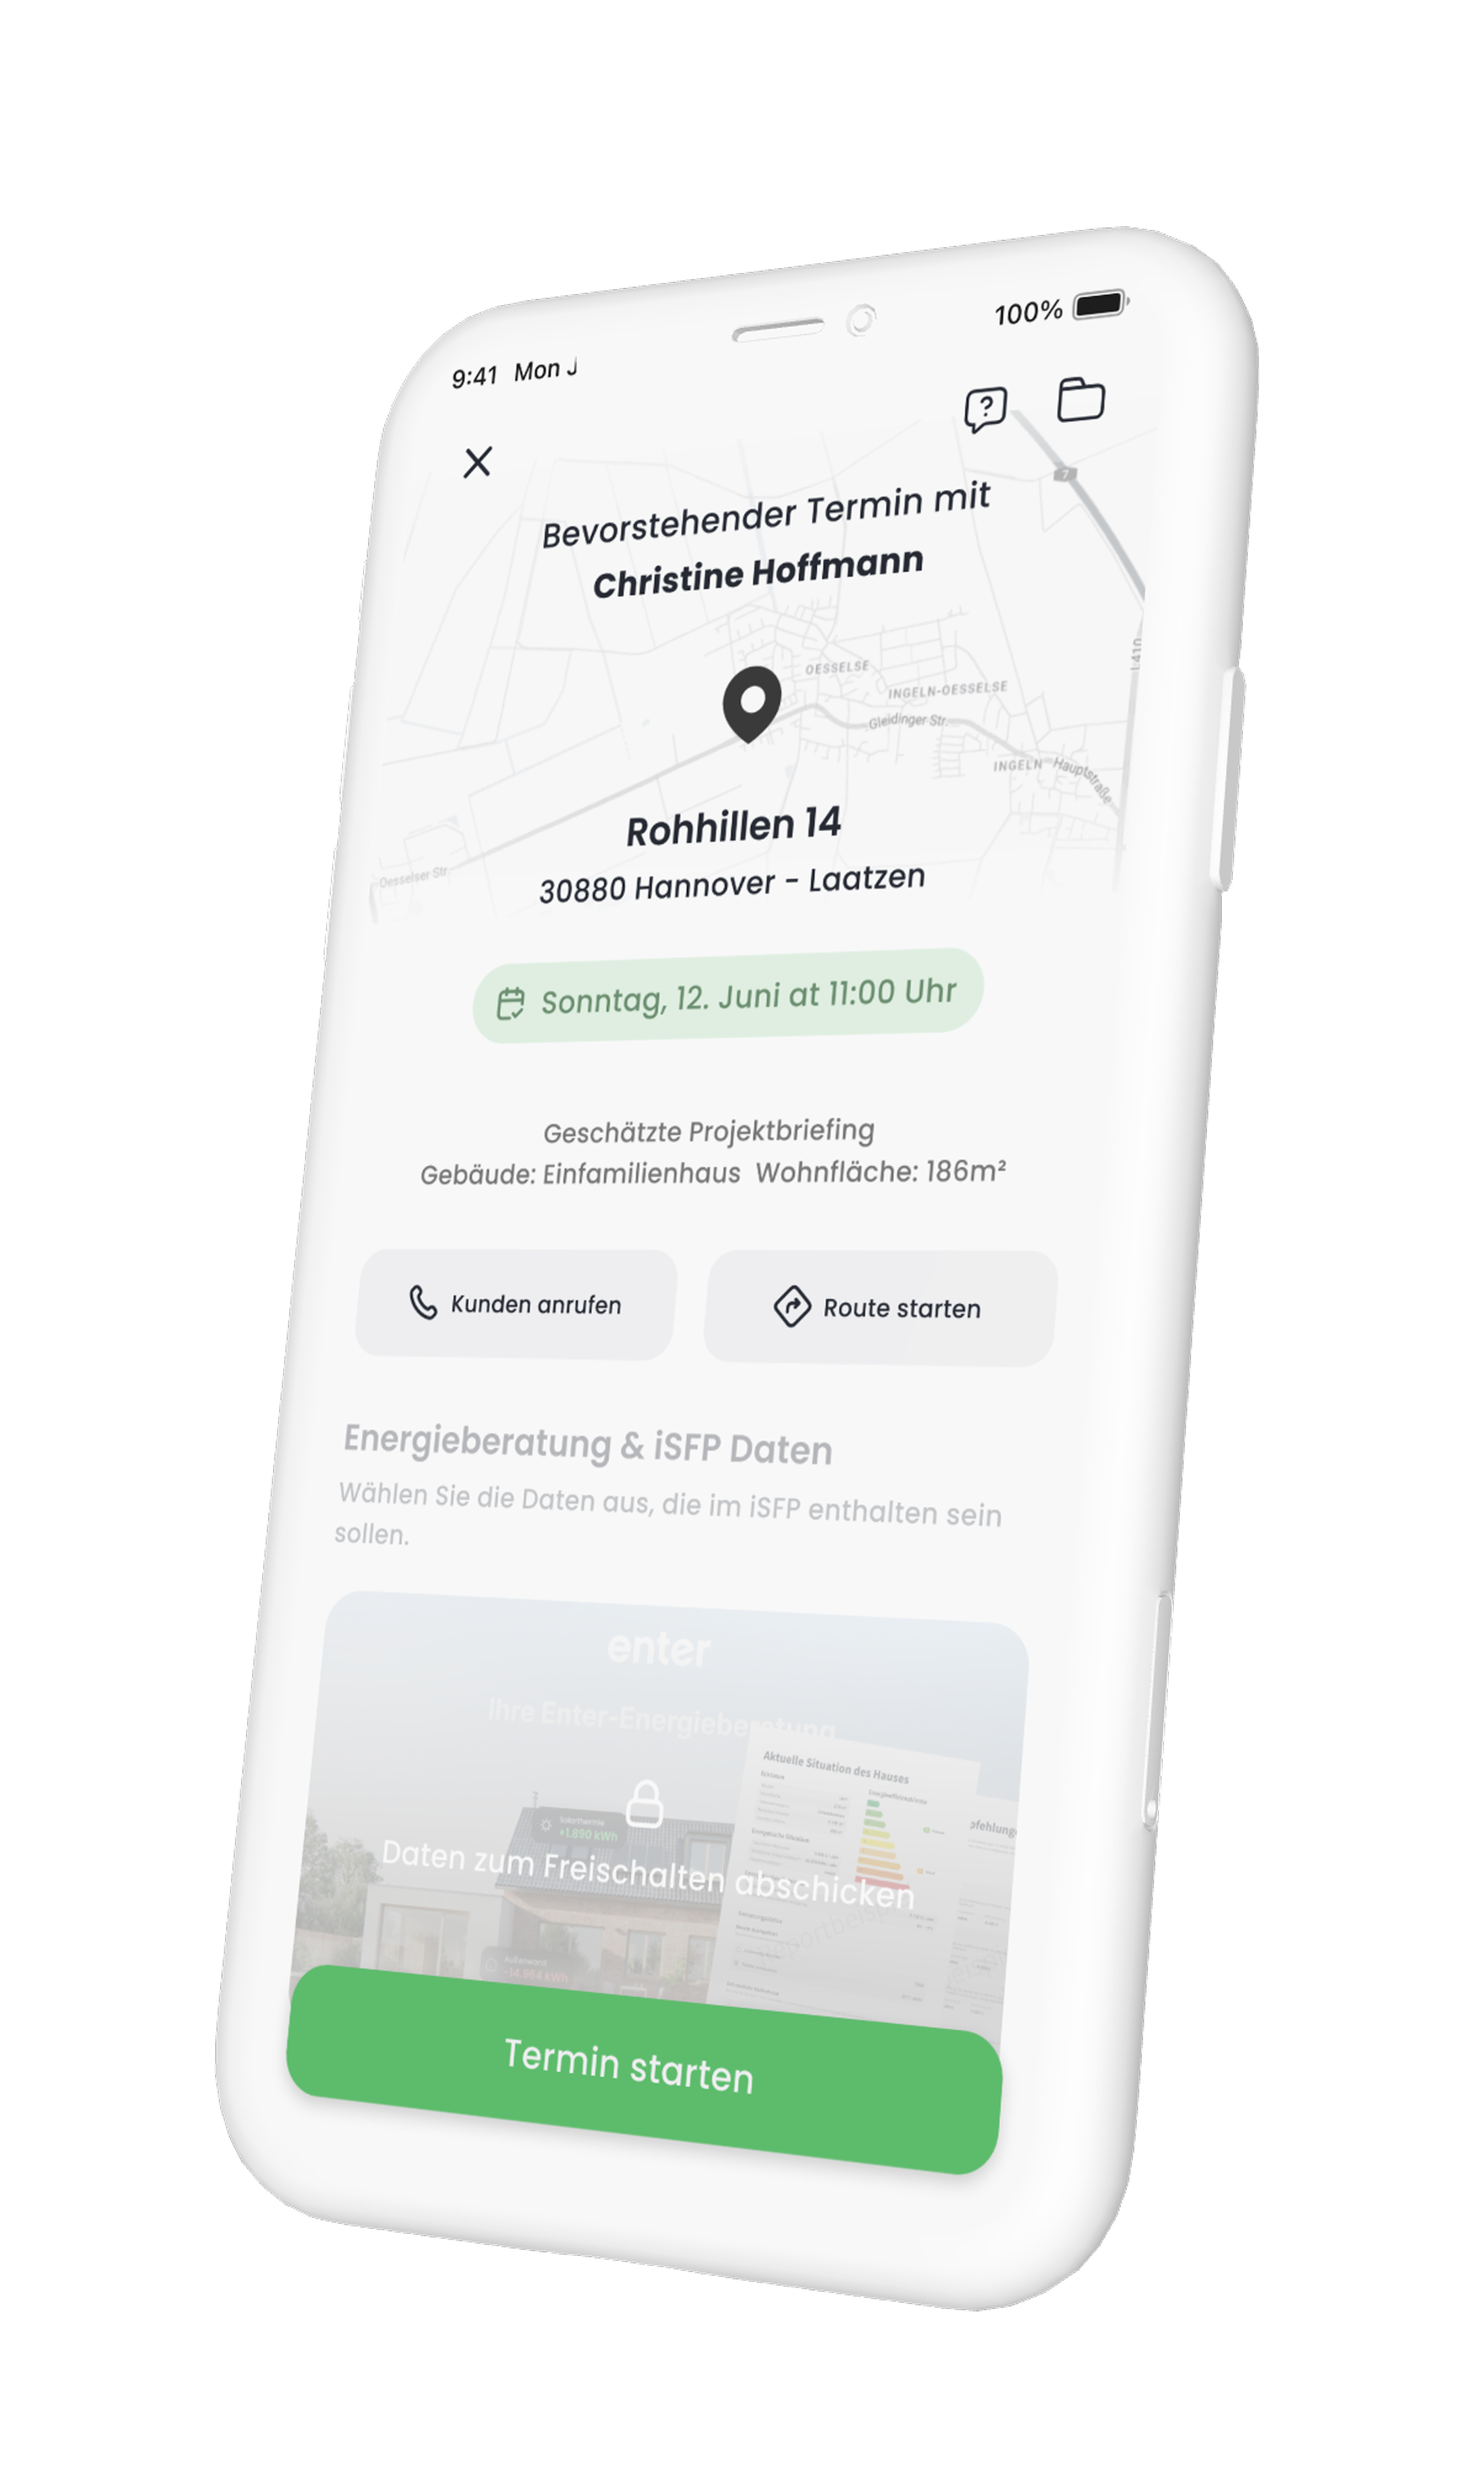
Before: data locked, “Termin starten” visible
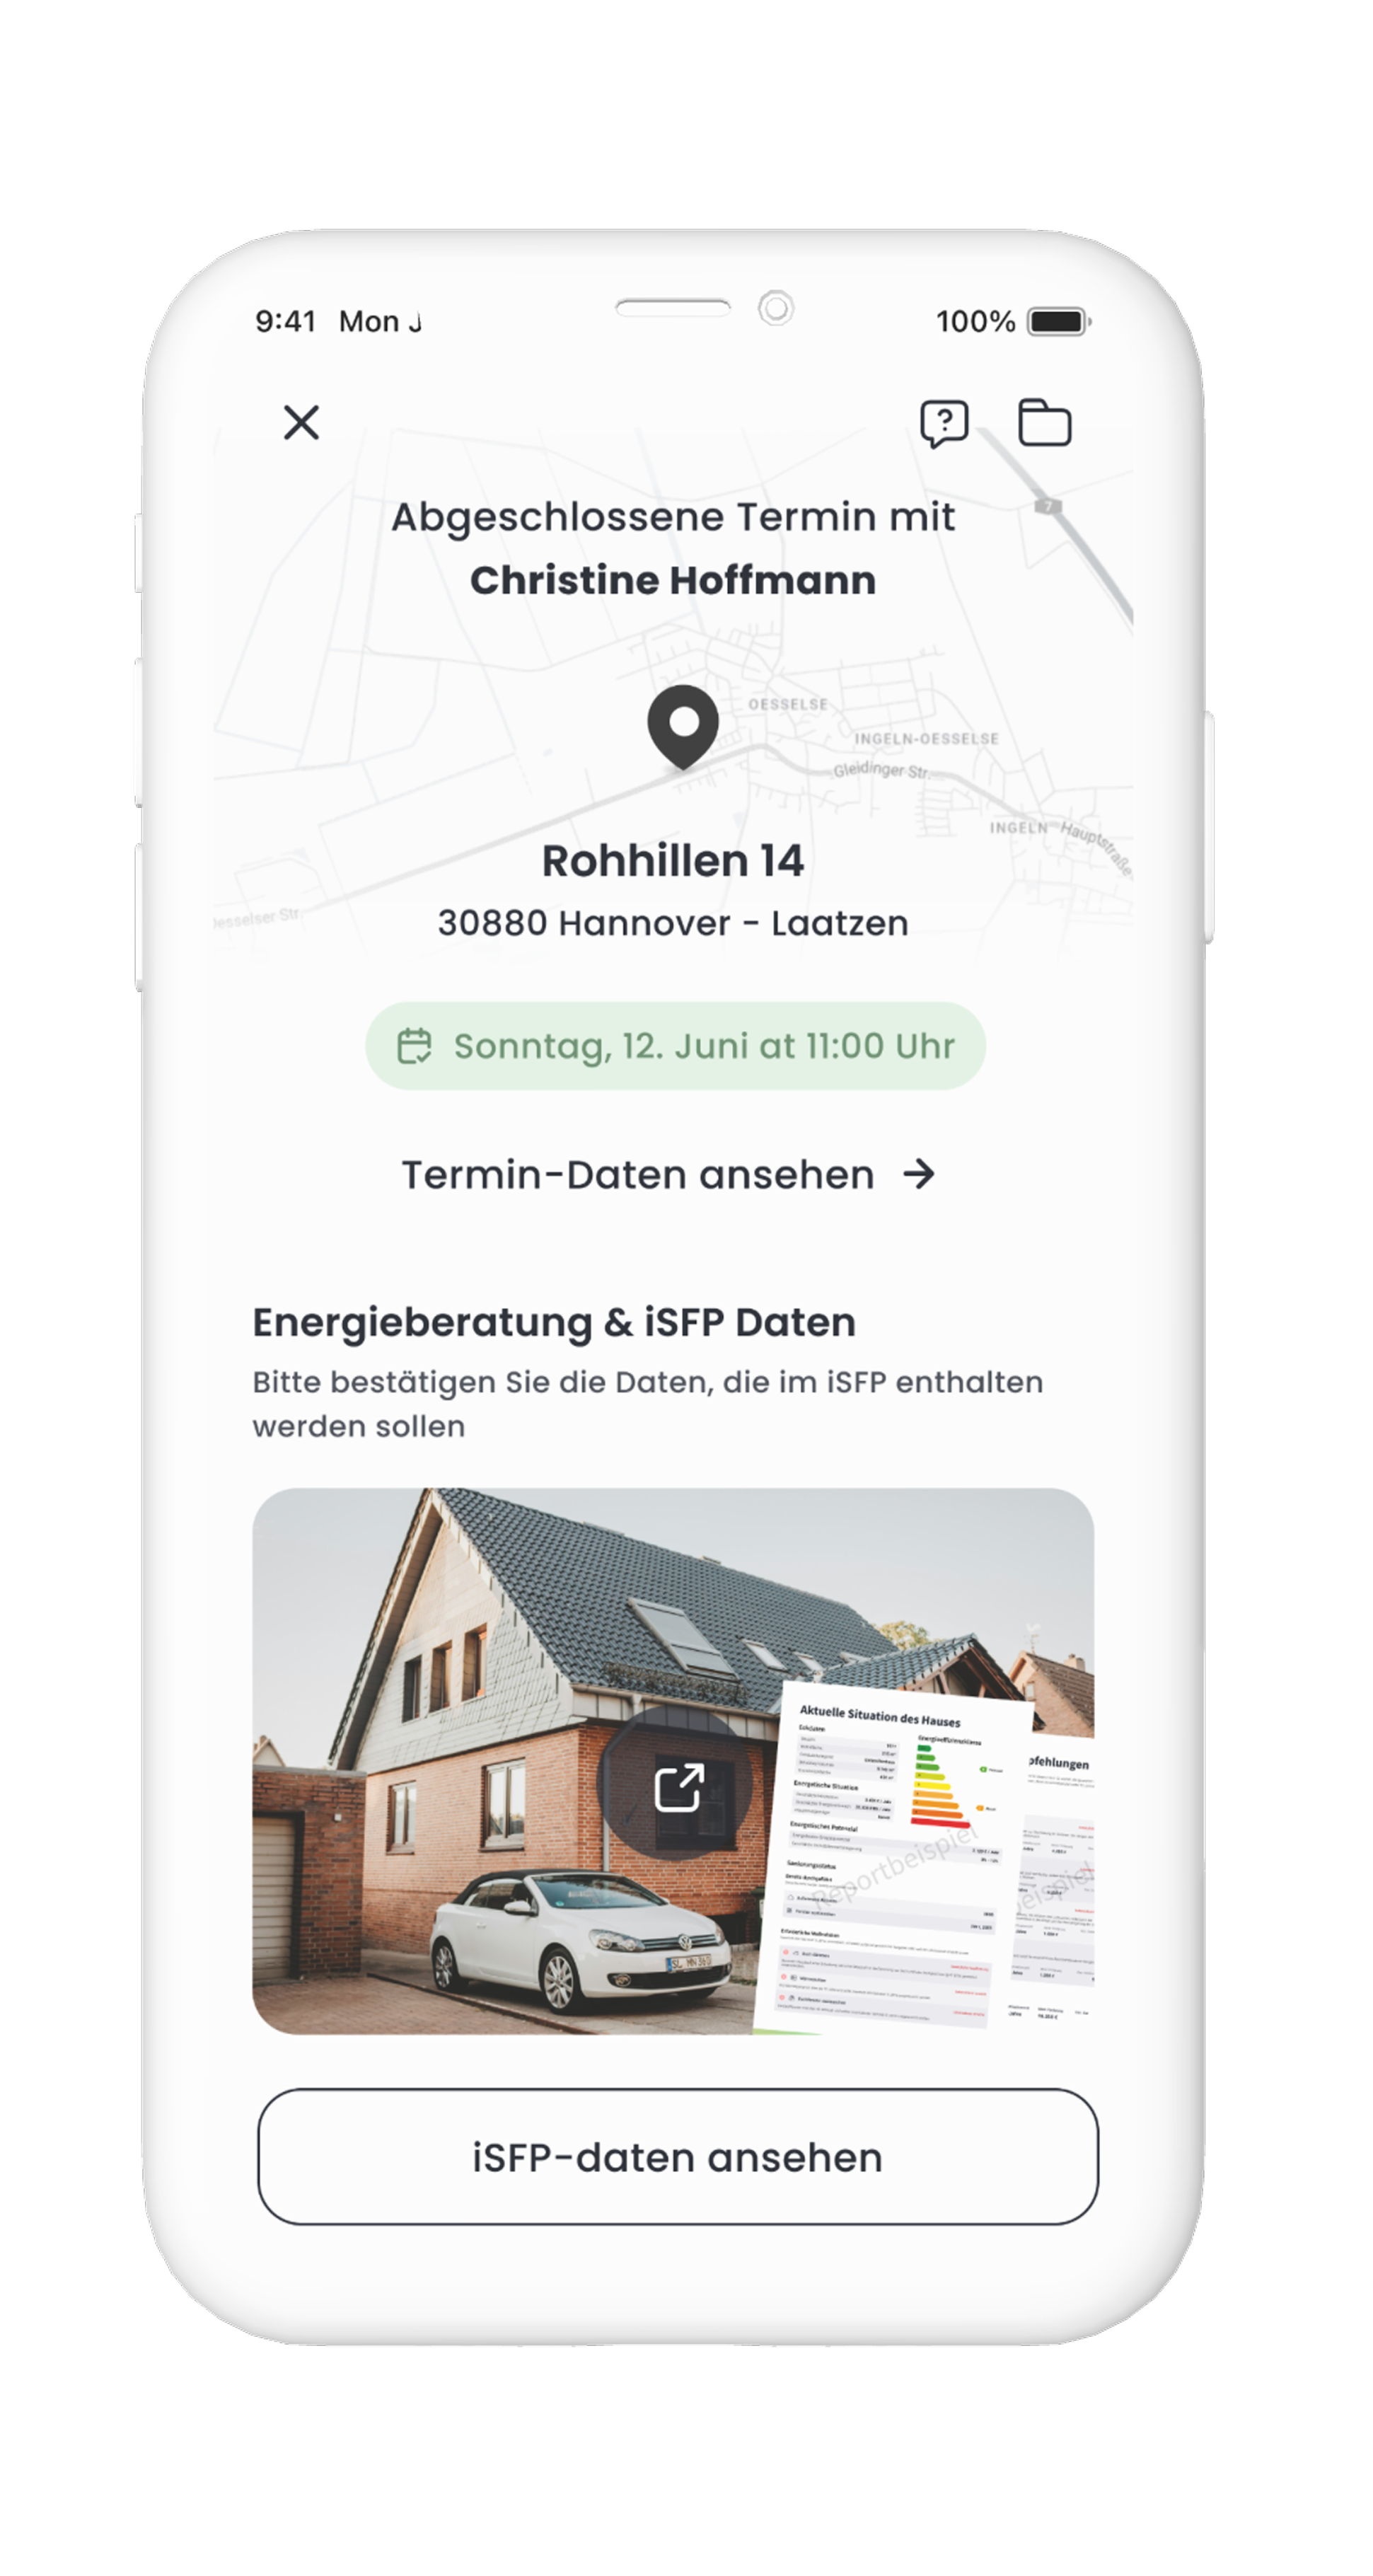
After: full data unlocked, iSFP ready
Building data capture
Every house is different.
Every detail matters.
The field tool was structured around the iSFP format: house data, systems, floors and rooms, and construction. Advisors navigated between tabs, drilling into each floor and room in turn. Nothing was free-text where it could be structured: dropdowns, toggles, and preconfigured options kept data clean and consistent for the AI model downstream.
Each section followed the same pattern: enter data, take photos if relevant, move on. The advisor always knew where they were in the survey and exactly what was left. On a 186m² detached house, that mattered.
01
House Data
Year built, footprint, energy costs, living area
02
Systems
Heating, hot water, ventilation, renewables
03
Floors & Rooms
Each storey: room count, area, windows, heating status
04
Construction
Walls, insulation, roof, basement: materials & U-values
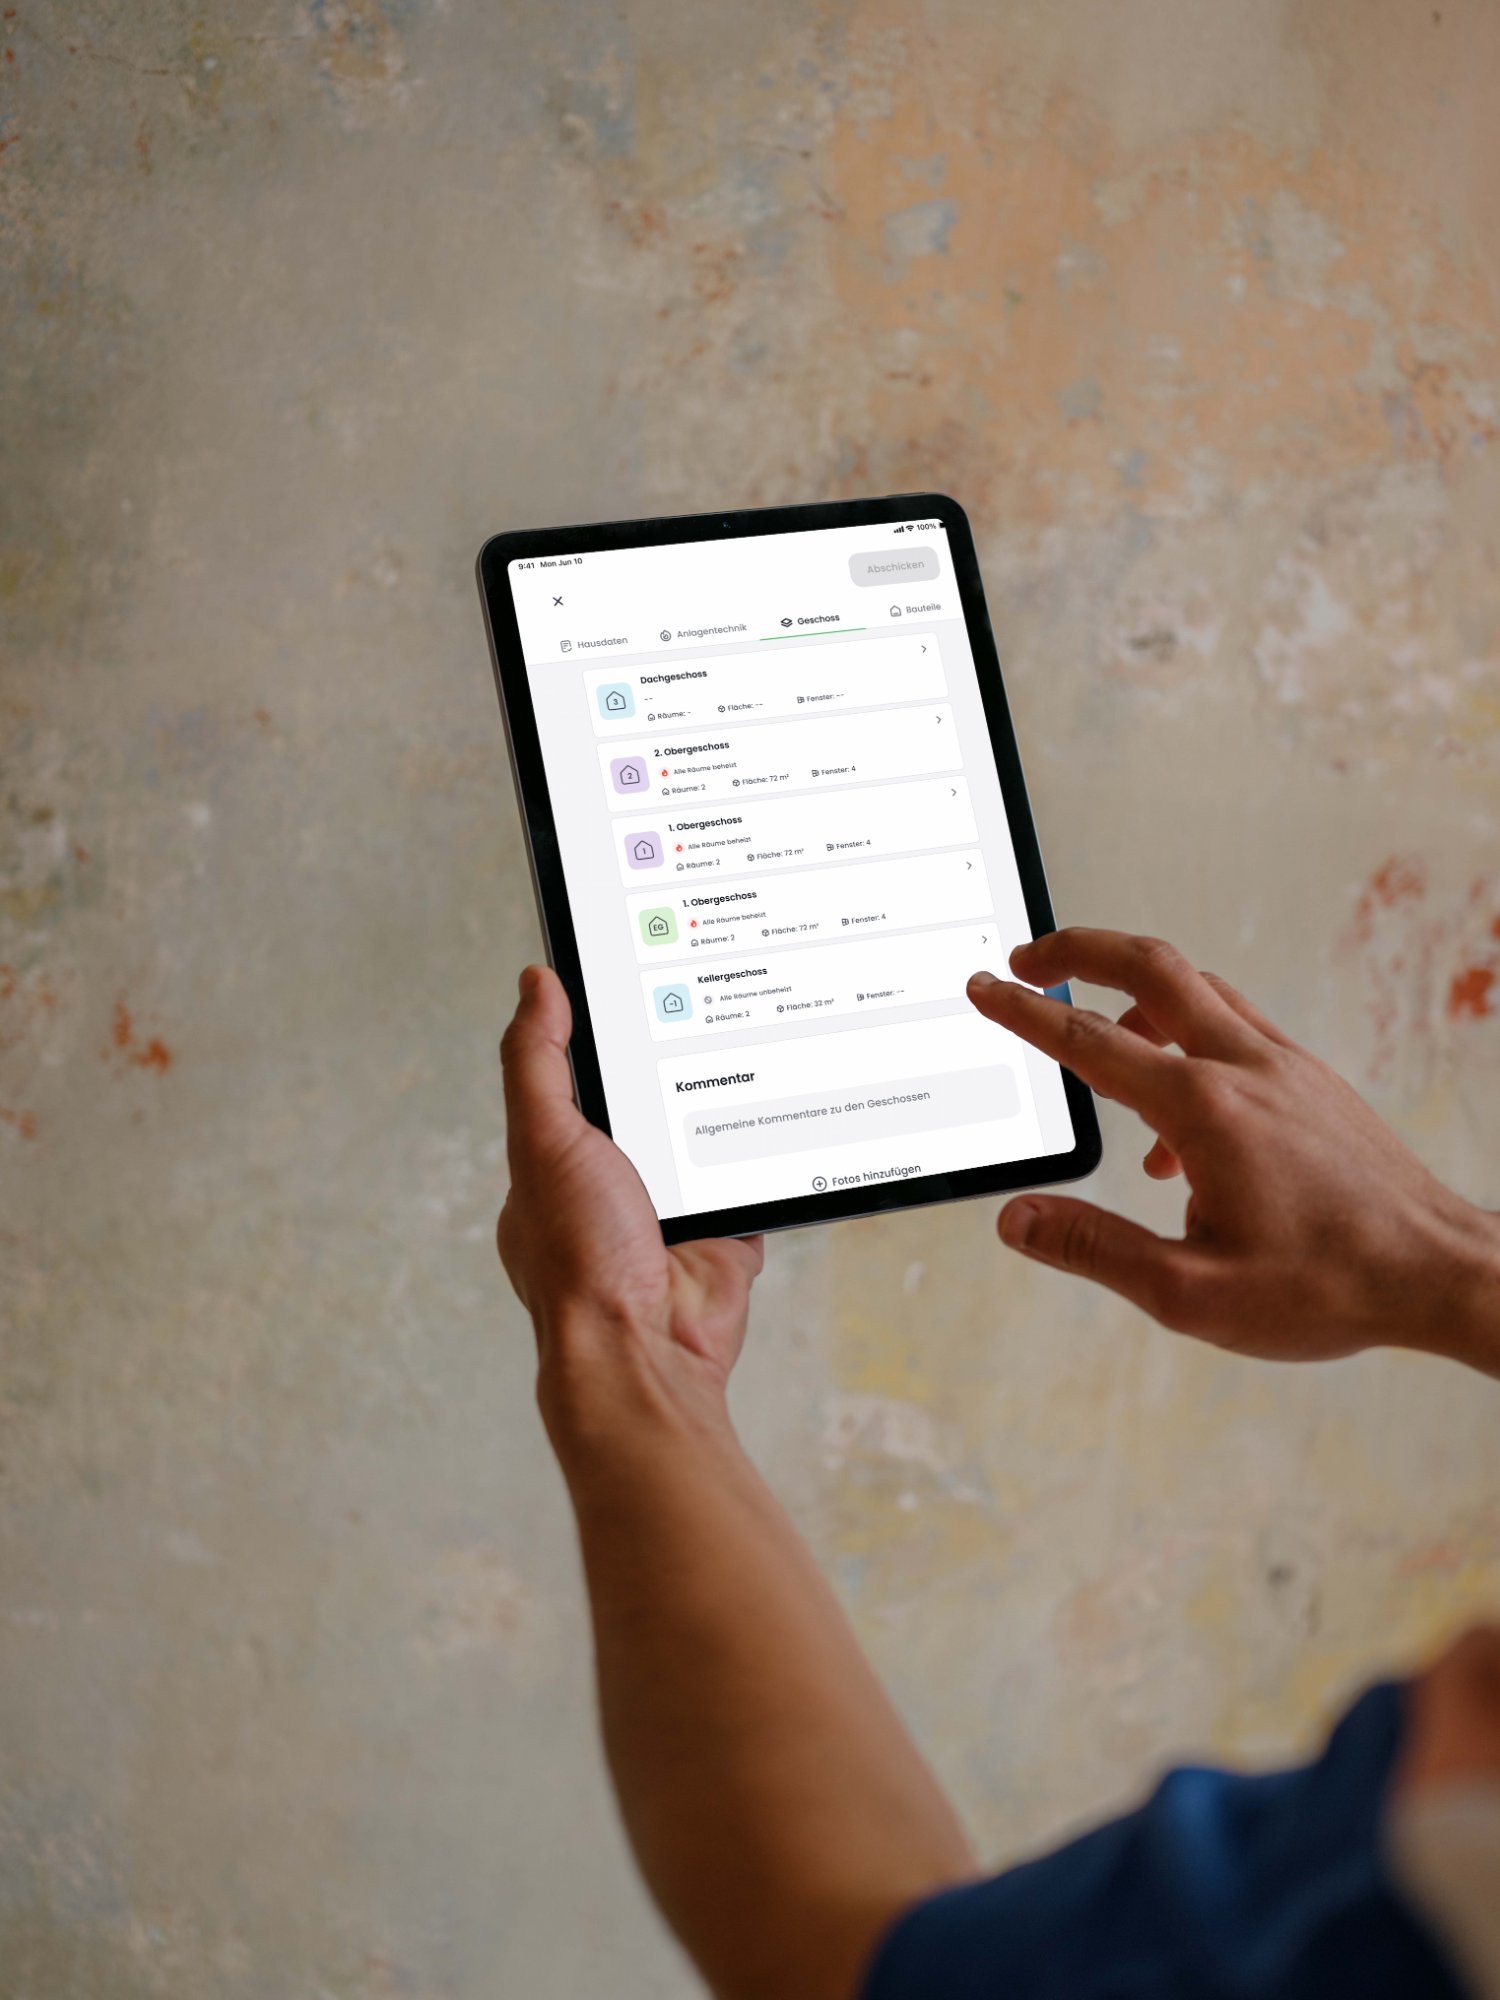
Floor and room structure: each storey drilled into in sequence
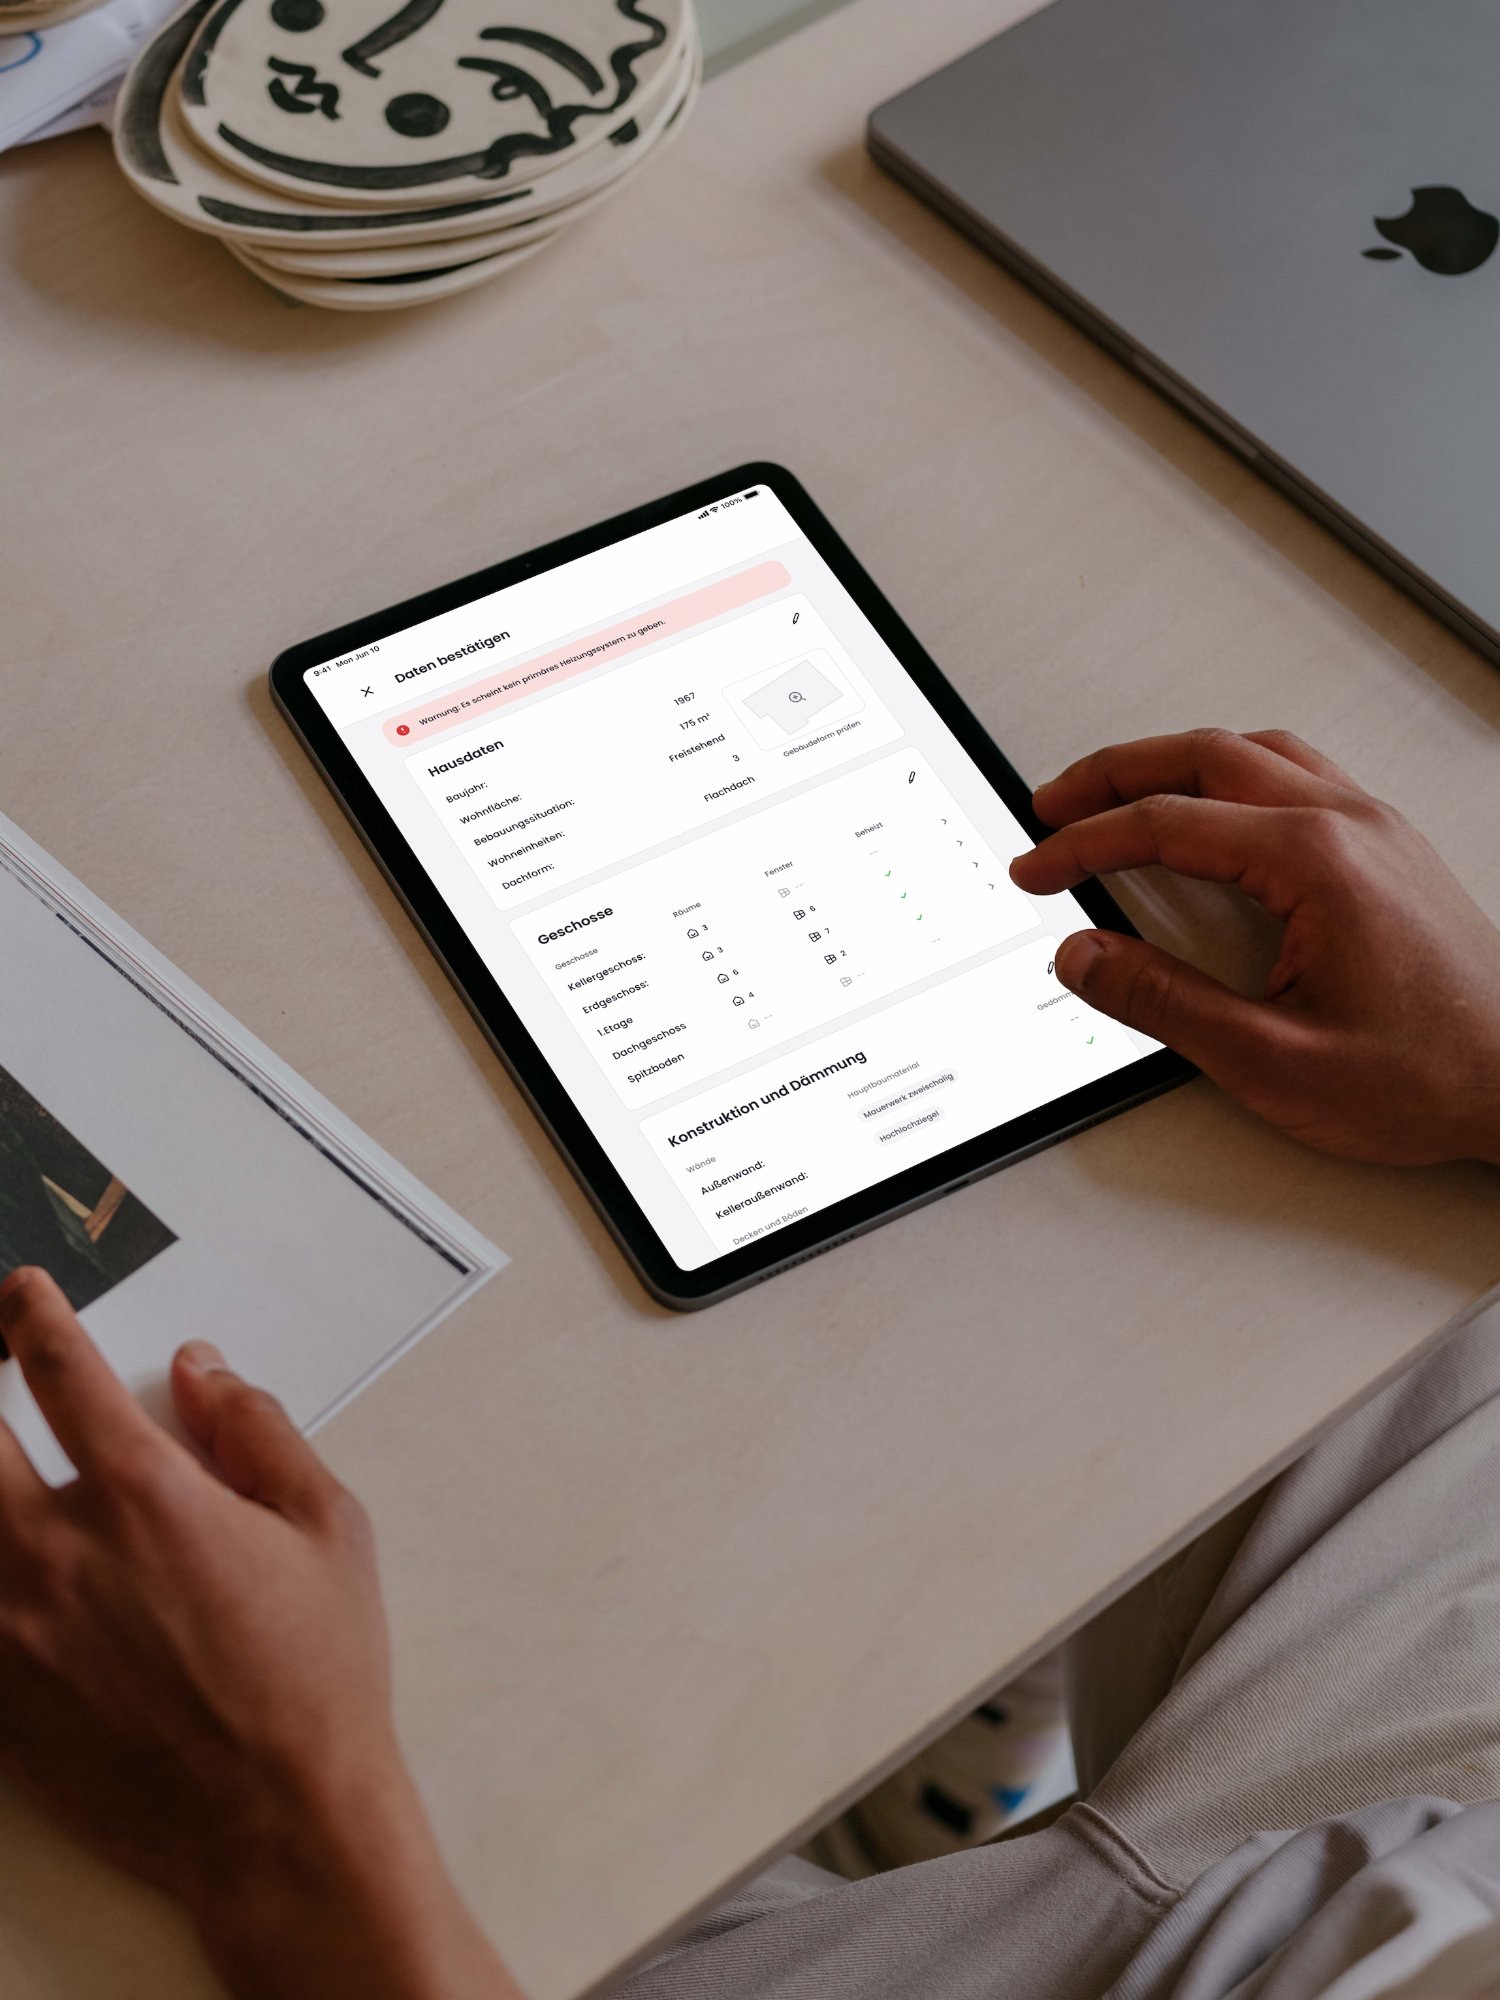
Data confirmation: all building data reviewed before submitting to AI processing
The floor plan feature
Window-level accuracy.
Built into the
floor plan.
Windows are one of the most consequential variables in an energy model. Their position, dimensions, and glazing spec all affect the U-value of the surrounding wall, which directly influences which retrofit measures make financial sense and which don’t. Getting this wrong skews the whole recommendation downstream.
The floor plan feature pulled in a pre-populated 2D footprint from cadastral and satellite sources, then let advisors place each window directly on the plan, dragging it to the correct wall, entering dimensions, confirming glazing type. One spatial interaction replaced three separate form fields.
The building footprint also served a second purpose: advisors could flag discrepancies between the registered data and what they observed on site, feeding corrections back into the dataset for future visits. Over time, the pre-populated data became more reliable.
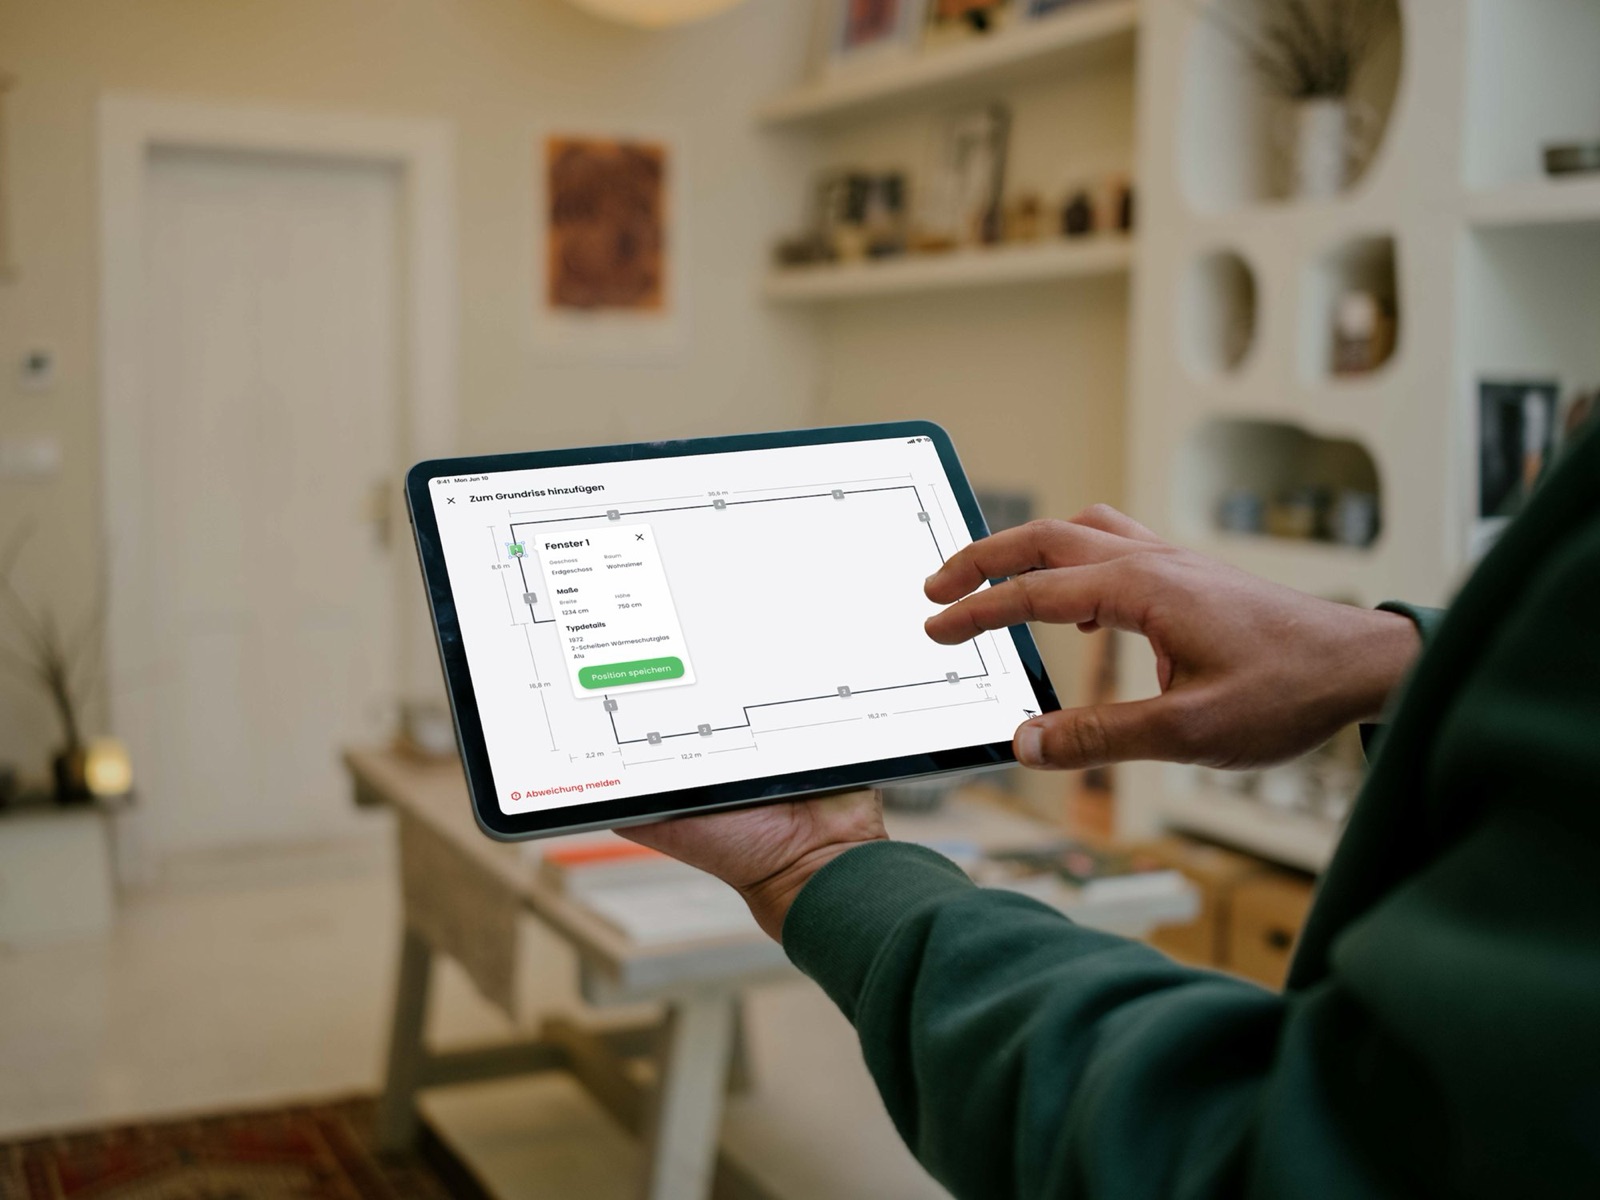
Placing a window on the 2D floor plan: position, size and glazing confirmed in one step
The customer report
Field data becomes
a plan a homeowner
can trust.
Once the field survey was submitted, the AI processed the assessment data and generated a draft report within seconds. Rather than returning for a second visit, the advisor stayed with the homeowner and used the report immediately to review the findings together.
I designed this part of the product from the ground up: a structured digital report that guided the conversation and helped the homeowner choose between the available retrofit options. Together they confirmed which measures went into the final Individual Renovation Roadmap (iSFP), the document behind the funding application.
The report
- 01 Future outlook Rising energy costs in the years ahead, and the subsidies available.
- 02 Current assessment The property’s energy performance today, and its savings potential.
- 03 Renovation roadmap Measures reviewed and chosen, ranked by saving, cost and suitability.
- 04 Your next steps When the iSFP arrives, and the quote comparison service that follows.
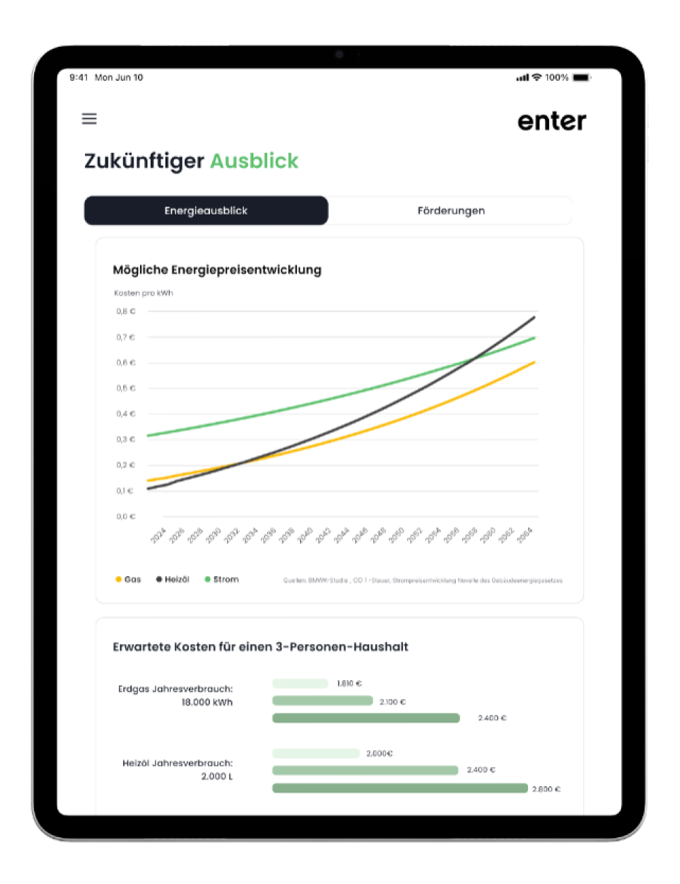
Future outlook
The cost of doing nothing
The report opened with energy prices rather than renovation costs. Projected gas, oil and electricity rates ran out to 2064, set against what this household was already spending each year. It gave the rest of the conversation a baseline: not what a retrofit costs, but what standing still costs.
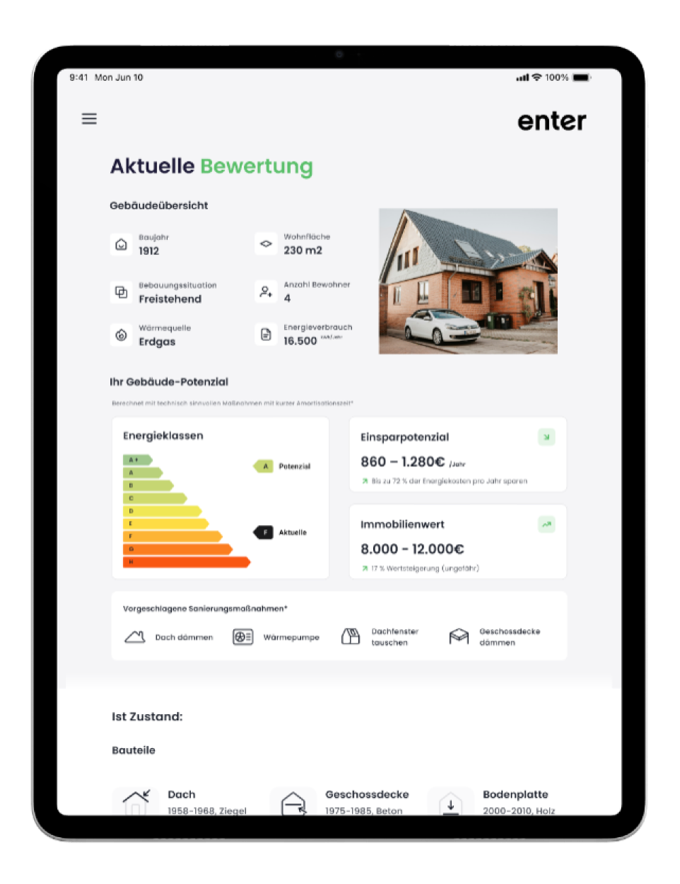
Current status
Where the building stands today
Year built, floor area, heat source and annual consumption, drawn straight from the survey the advisor had completed minutes earlier in the same house. Beside it, the current energy class and the class the building could realistically reach. Homeowners recognised their own property here, which is what made the numbers credible.
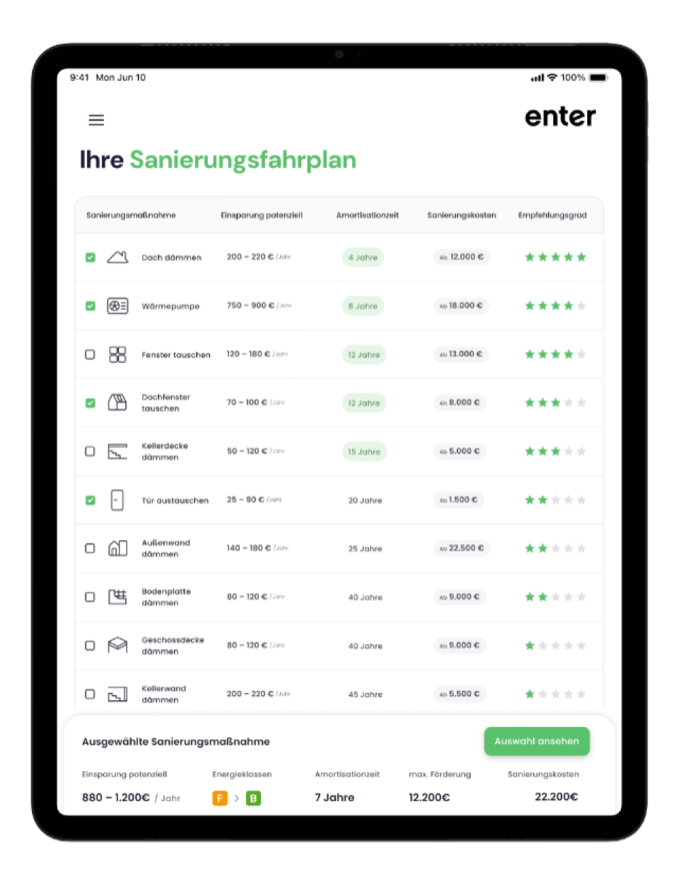
Renovation measures
Every measure, ranked
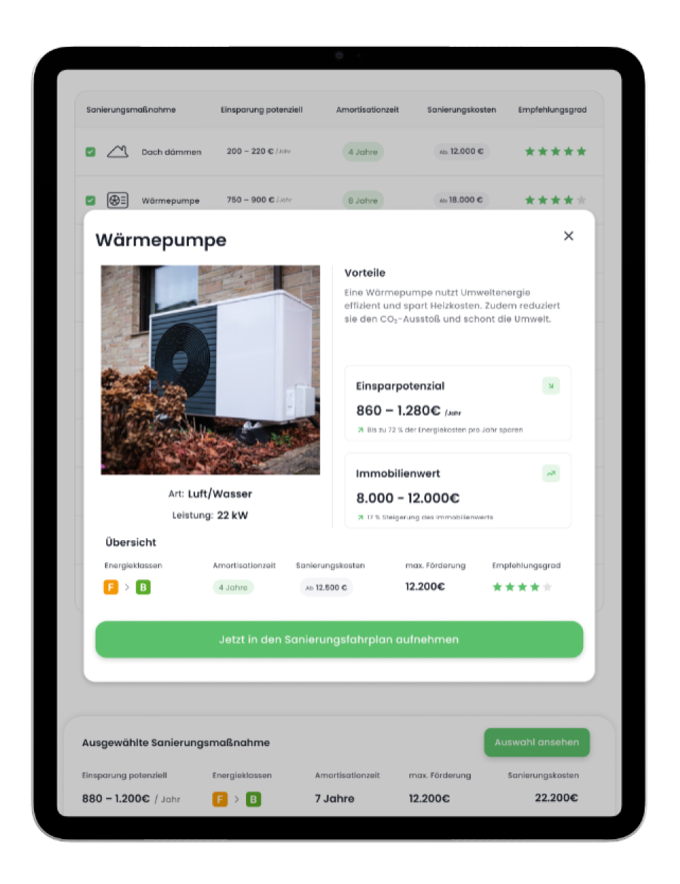
The AI’s full set of recommendations in one table: annual savings, payback period, cost and a recommendation rating for each measure. Ticking a measure updated the totals along the bottom, so the pair could assemble a package and watch the combined saving, energy class and subsidy move as they went.
Renovation details
What one measure does on its own
Opening a measure showed it in isolation: what it saves, what it costs, the subsidy it attracts, the payback period and the energy class it moves the building to. This was usually where the decision happened.
Product metrics
How success was defined.
Time on siteReducing time spent on property visits without sacrificing data quality.
iSFP turnaroundShortening the time from site visit to completed iSFP.
Retrofit salesHelping more homeowners move forward with recommended measures.